
Data & AI
UCD

View more blogs
Whether you’re a data practitioner or someone who works alongside data, you’ll know how daunting it can be to make sense of it – or help others do the same – but you rely on the numbers to shape the insights you need to make decisions that matter.
This blog explains how storytelling techniques and service design bridge the gap between technical complexity and real-world understanding, all while shattering silos and shaping shared success.
Where does the story start?
A story has a beginning, middle, and end – but when data is scattered across all three, the plot quickly gets lost and the story is left on the shelf. Data is powerful, but only when it’s clear, credible, and capable of influencing decisions.
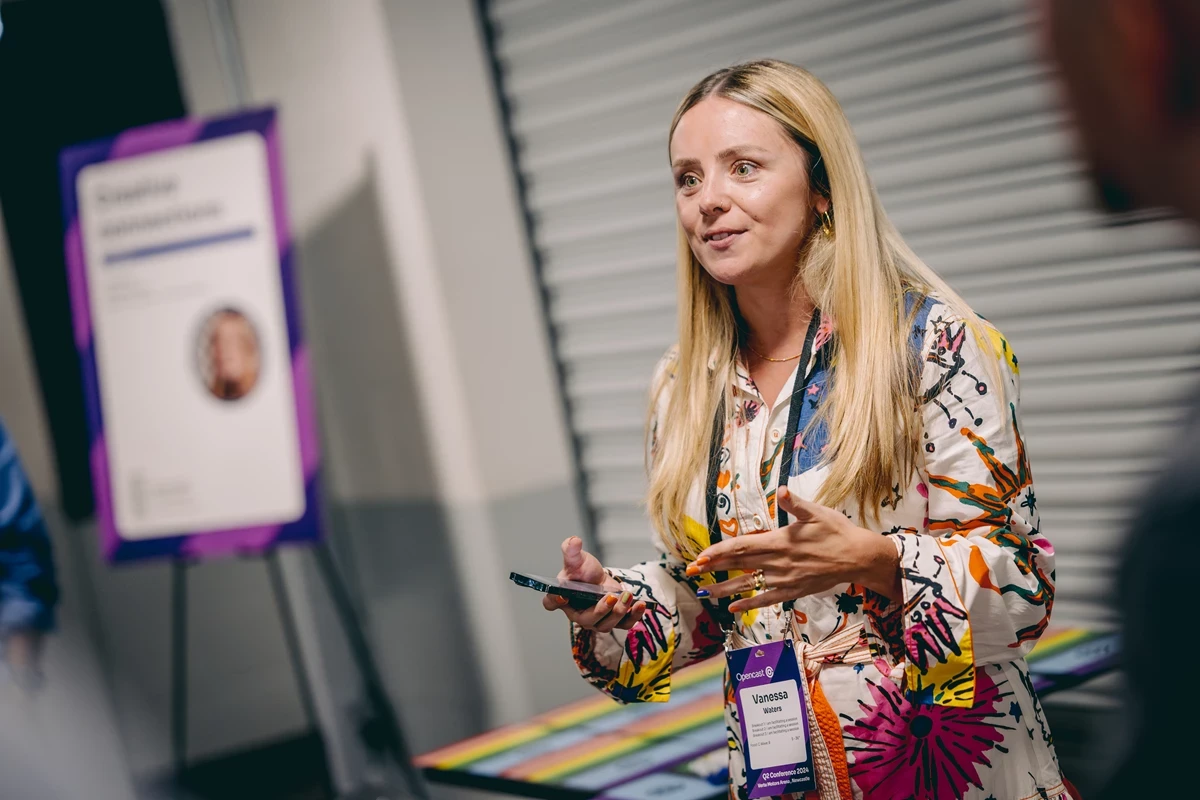
Having spent more than a decade working in service design and strategy across public and private sectors, the same challenge has surfaced time and again, quietly eroding public trust and setting off a chain reaction that leads to poor user-centred decisions and funding choices that drift off course.
While the maths and models can be complex, they’re often not the hardest part to get right. It’s the message. Framed the wrong way, complexity doesn’t enlighten, it intimidates.
That’s where user-centred design (UCD) comes in. And more specifically, storytelling as a service design skill. Not to soften the facts, but to turn understanding into action that enables progress and tangible change.

When silos seed suspicion
Often the challenge starts when data and UCD teams are working in parallel rather than in partnership. One side lives in a world of numbers, chasing precision and patterns, whilst the other follows human stories, uncovering pain points and imagining better experiences. Both are rigorous, both are essential, but without a bridge between them, the story gets lost in the numbers, and the numbers get lost in the story.
When that bridge is missing internally, the impact quickly extends outward. Removed from the detail, stakeholders can focus on the evidence but struggle to see how it connects to the human side – the context, the emotion, the relativity that gives the numbers meaning. Evidence alone tells only half the story; without the narrative around it, its implications remain distant and difficult to act on.
This imbalance matters. Rather than confident challenge, the absence of context breeds caution. Momentum doesn’t stall through resistance, it stalls because no one feels confident enough to take the first step into a decision where design and data work together to show, not just tell, what’s the right thing to do.
Storytelling as sense-making
To move forward, storytelling must take centre stage – as a sense-making tool, not a stylistic flourish. Some stories are written in words, others drawn in images, but together they open a chapter on insight, turning complexity into a story anyone can follow.
Working closely with data teams in different projects, I’ve used basic storytelling approaches – framing, sequencing, and mapping – to explore:
The story behind the numbers: the problem data is solving and why it matters
Where the numbers lead: the decisions data can confidently inform – and where human judgement is still needed
The gaps in the tale: the limitations and dependencies that shape how data should be interpreted.
Insight to impact: Trust that unlocked traction
The complexity doesn’t disappear, but it finds form as statistical logic and design insight merge into a story that links purpose, process, and impact, helping technical and design teams come together to communicate with confidence and clarity while building trust across diverse stakeholders.
With trust established, questions about statistical foundations lose their weight, becoming bumps rather than barriers on the path to project outcomes. Storytelling doesn’t just clarify data – it turns it into a tool people can more easily trust and use.
After all, as designers, we navigate ambiguity every day and complexity isn’t an excuse to hide behind numbers – it’s a call to craft processes that guide decisions and spark action, reminding us that while the end user is our focus, it takes a team to bring that vision to life.
A key takeaway: Something to remember…
Try staying curious. Collaborate openly. Shape your data with design and shape your design with insight.
If you don’t, your insights will stay trapped in spreadsheets, and your impact will stay unrealised.
Published: February 2026
OpenPerspectives is our platform for Opencast people to share their thoughts and perspectives on modern digital delivery. It offers practical insight into user-centred design, engineering excellence, product leadership, data-driven decision making and building expert capabilities, grounded in real-world experience.
Related Content


View more blogs